Our tour of your relief dashboard begins this month with a look at the “Year to Date Fund Snapshot” page; consider this the homepage of your dashboard.
This page offers you a brief overview of your program’s key information and serves as a high-level look into the current state of your program. Most sections of this dashboard are interactive, leveraging Microsoft’s Power BI tools to allow you to click into different areas to generate deeper insight. In future issues of the Relief Brief, we will explore the details found on other dashboard pages.
The “Year to Date Fund Snapshot” page is intended to provide a view of the current moment for your fund, highlighting three key aspects of your program:
-
Fund Balance
-
Applications
-
Donations
As a general note, for this page, when we say “Year to Date”, which we abbreviate to YTD, this means for the current calendar year – January to this current month. So, if you go to the dashboard after reading this overview, the data shown on this homepage will be Jan. 1, 2023, through the date you are reviewing the page.
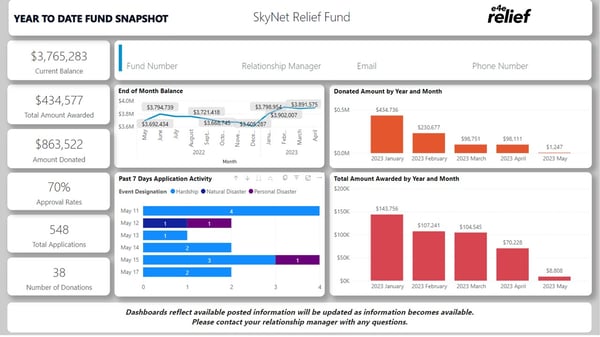
Fund Balance: In the top left-hand corner, you will find the current fund balance (updated every four hours). We recommend reviewing your fund balance often to help track the sustainability of your fund and if you need to make additional contributions leading into disaster season or to plan for the month-end application fees deduction. Please remember that, while this is considered your current balance, meaning it reflects any grants awarded through the current day, it does not reflect application fees associated with received applications; those are deducted the month following an application’s closure.
Also of note related to your balance is the line chart in the center section, where you can review your end-of-month balance for the previous 12 months, which can help you track the cycle of utilization of your program, again helping you gauge fund sustainability for short and long-term planning. Immediately below the Current Balance, you can also see the YTD total of grants awarded; a bar graph in the lower right-hand corner shows grants awarded, year to date, for the subsequent months as well.
Applications: This page also shows information about applications received YTD in the left-hand blocks and over the past seven days in the horizontal bar graph. This graph is particularly helpful in the wake of disasters when the level of relief applications changes frequently and your team wants to know how many requests are coming into the fund.
Donations: Topline donation summaries of dollars donated and number of donations YTD can also be found within this snapshot page. Donations are also shown by month in the top right-hand corner, which can be particularly helpful as you evaluate your fundraising messaging, processes and strategies.
In times of crisis, it’s important to have information at your fingertips. The “Year to Date Fund Snapshot” provides that information in a way that makes it easy to assess the financial viability of your program and if there is any need for additional resources.
If you are having trouble viewing any part of your dashboard or you need additional support, please contact your Relationship Manager.